
Ch00 Practice1
Yang Haoran 6/12/2022 DL
# Ch00 Practice1
install numpy:
pip install numpy
pip install matplotlib
1
2
2
# 1D
在-1到1之间均匀取数并绘图:
class Dataset:
    def __init__(self):
        self.data = set()
        self.create_dataset(100)
        self.sample_num = 100

    def create_dataset(self, num):
        self.sample_num = num
        self.data.clear()
        for x in np.linspace(-1, 1, self.sample_num):
            self.data.add((x, 0.1 * x + np.power(x, 2) + np.power(x, 3)))
1
2
3
4
5
6
7
8
9
10
11
12
2
3
4
5
6
7
8
9
10
11
12
if __name__ == '__main__':
    # 2.2
    # data1 = set()
    # for x in np.linspace(-1, 1, 100):
    #     data1.add((x, 0.1 * x + x ** 2 + x ** 3))
    # print(data1)
    dataset = Dataset()
    # dataset.create_dataset(10)
    # print(dataset.data)
    x = []
    y = []
    for t in dataset.data:
        x.append(t[0])
        y.append(t[1])
    print(x)
    print(y)
    plt.figure(figsize=(5, 5))
    plt.xlim((-1, 1))
    plt.xticks(np.linspace(-1, 1, 5))
    # 第一个字母表示颜色,第二个字母表示形状,bo就是蓝色的圆圈,r*就是红色星星,g^就是绿色三角
    plt.plot(x, y, 'bo')
    plt.show()
1
2
3
4
5
6
7
8
9
10
11
12
13
14
15
16
17
18
19
20
21
22
2
3
4
5
6
7
8
9
10
11
12
13
14
15
16
17
18
19
20
21
22
# 2D
取正态分布随机数并绘图
# 第一个参数均值,第二个参数方差
x = np.random.normal(0, 1, 1000000)
plt.hist(x, 1000)
1
2
3
2
3
根据x分类并绘图:
class Dataset2:
    def __init__(self):
        self.mu = 0
        self.sigma = 1
        self.data = set()
        self.create_dataset(1000, 0, 1)
        self.sample_num = 1000

    def create_dataset(self, num, mu, sigma):
        self.mu = mu
        self.sigma = sigma
        self.sample_num = num
        self.data.clear()
        np.random.seed(42)
        for x in np.random.normal(self.mu, self.sigma, self.sample_num):
            if np.power(x,2) < 1:
                self.data.add((x, 0))
            else:
                self.data.add((x, 1))
1
2
3
4
5
6
7
8
9
10
11
12
13
14
15
16
17
18
19
20
21
2
3
4
5
6
7
8
9
10
11
12
13
14
15
16
17
18
19
20
21
dataset2 = Dataset2()
x1 = []
x2 = []
y1 = []
y2 = []
for t in dataset2.data:
    if t[1] == 1:
        x1.append(t[0])
        y1.append(t[1])
    else:
        x2.append(t[0])
        y2.append(t[1])

plt.figure(figsize=(5, 5))
# plt.xlim((-10, 10))
# plt.xticks(np.linspace(-10, 10, 5))
plt.plot(x1, y1, 'r^')
plt.plot(x2, y2, 'bo')
plt.show()
1
2
3
4
5
6
7
8
9
10
11
12
13
14
15
16
17
18
19
2
3
4
5
6
7
8
9
10
11
12
13
14
15
16
17
18
19
# 卷积
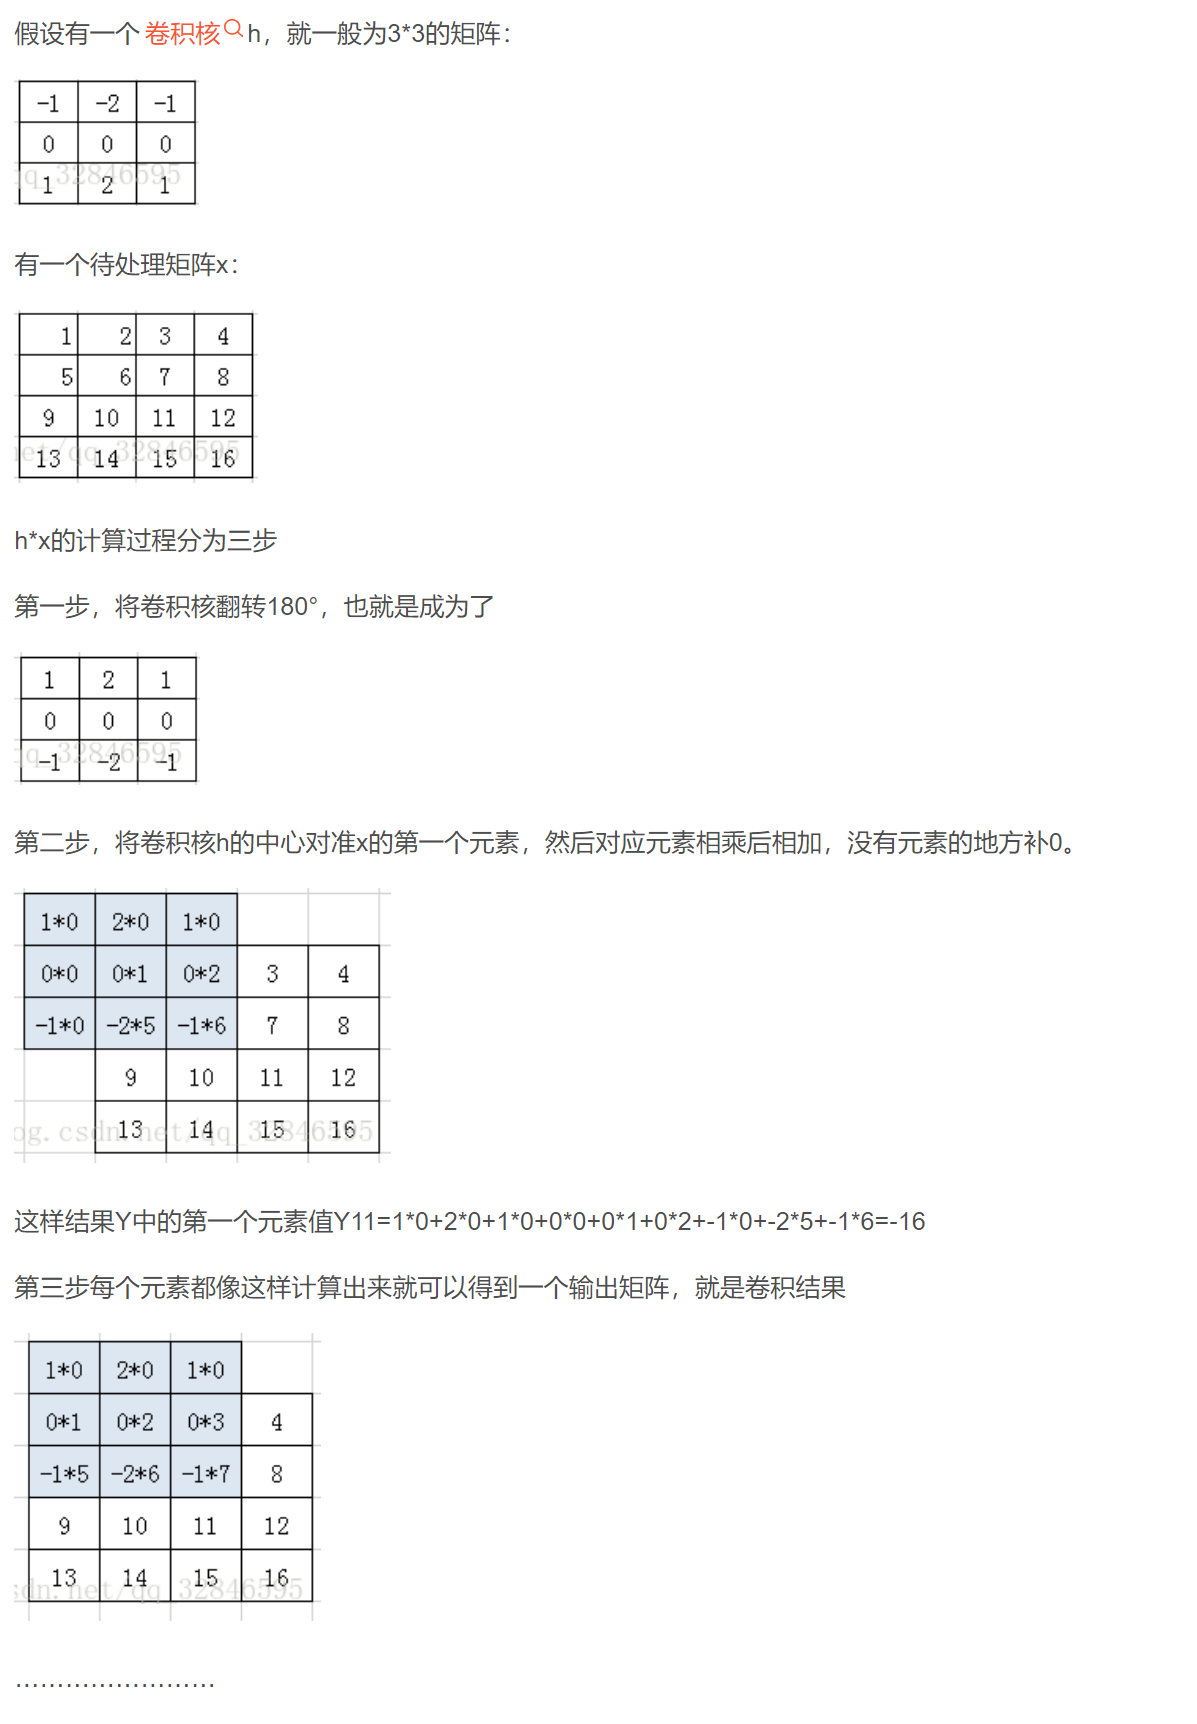
矩阵旋转180° == 上下翻转+左右翻转
np.flip(np.flip(filter, axis=0), axis=1)
1
生成数组
import numpy as np
from scipy import signal

filter = np.ones([2, 2])
print(filter)
a = np.arange(0, 16, 1).reshape((4, 4))
print(a)
1
2
3
4
5
6
7
8
2
3
4
5
6
7
8
二维数组卷积并验证:
def convolve(x: np.array, filter: np.array):
    # rotate
    temp = np.flip(np.flip(filter, axis=0), axis=1)
    # print("temp---")
    # print(temp)
    # output size
    result = np.ones([x.shape[0] - filter.shape[0] + 1, x.shape[1] - filter.shape[1] + 1])
    for i in range(x.shape[0] - filter.shape[0] + 1):
        for j in range(x.shape[1] - filter.shape[1] + 1):
            # print("x-----")
            # print(x[j:j+filter.shape[0], i:i+filter.shape[1]])
            result[i][j] = (x[i:i+filter.shape[0], j:j+filter.shape[1]] * temp).sum()
    return result
1
2
3
4
5
6
7
8
9
10
11
12
13
14
2
3
4
5
6
7
8
9
10
11
12
13
14
filter = np.ones([2, 2])
input = np.arange(0, 16, 1).reshape((4, 4))
print(input)
print(convolve(input, filter))
# convolve(filter, input)
# print(input)
print(signal.convolve2d(input, filter, mode="valid"))
1
2
3
4
5
6
7
2
3
4
5
6
7